

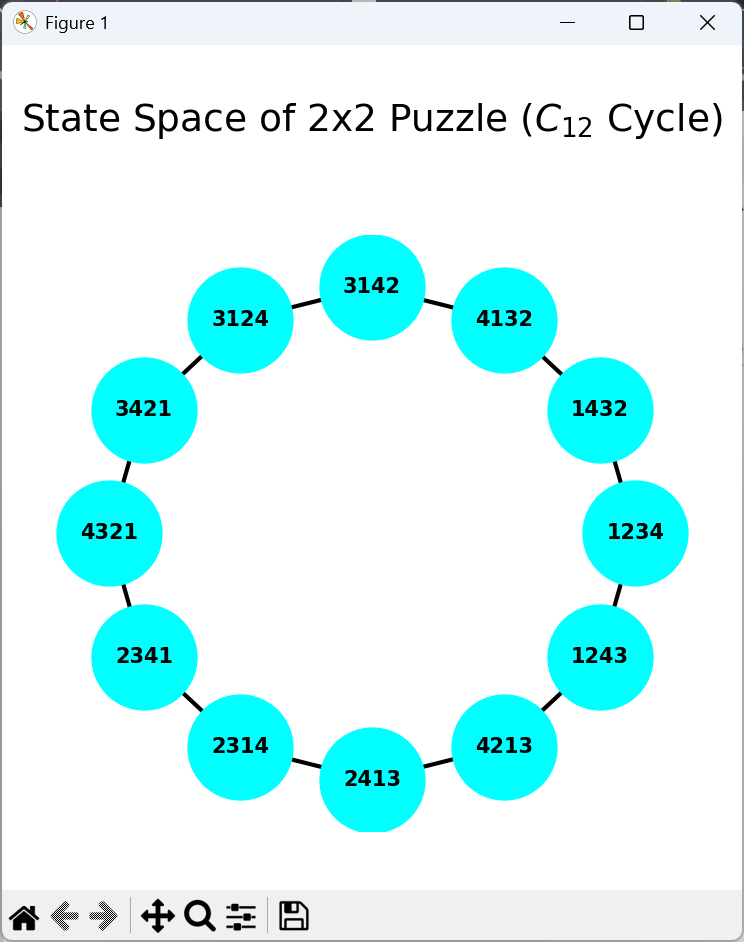
前回数字パズルのプログラムをつくりました。2✕2のマスに1から4の数字のタイルを入れると、組み合わせは 4! = 24 となります。ただ、数字パズルのスライドする性質上そのうちの12個しか実現できません。この12個の状態をグラフで表してみます。Pythonでnetowrkxとmatplotlibというライブラリを使います。
# puzzle-graph.py
# Version 0.1.0
# 2x2 数字パズルの状態遷移グラフを描画
# Copyright © 2025 Nonki Takahashi.  The MIT License.

import networkx as nx
import matplotlib.pyplot as plt
from itertools import permutations

empty = '4'

def get_neighbors(state):
    """2x2グリッドの移動ルール"""
    adj = {0: [1, 2], 1: [0, 3], 2: [0, 3], 3: [1, 2]}
    e_idx = state.index(f"{empty}")
    res = []
    for n_idx in adj[e_idx]:
        lst = list(state)
        lst[e_idx], lst[n_idx] = lst[n_idx], lst[e_idx]
        res.append("".join(lst))
    return res

def get_invariant(state):
    """パズルの不変量(パリティ)計算"""
    s = [int(c) if c.isdigit() else 4 for c in state]
    inv = sum(1 for i in range(len(s)) for j in range(i + 1, len(s)) if s[i] > s[j])
    e_idx = state.index(f"{empty}")
    pos_parity = (e_idx // 2) + (e_idx % 2)
    return (inv + pos_parity) % 2

# 1. 状態の抽出とグラフ構築
start_node = f"123{empty}"
target_inv = get_invariant(start_node)
reachable_nodes = ["".join(p) for p in permutations(f"123{empty}") if get_invariant("".join(p)) == target_inv]

G = nx.Graph()
for s in reachable_nodes:
    for n in get_neighbors(s):
        if n in reachable_nodes:
            G.add_edge(s, n)

# 2. 交差をなくすために、隣接順のリストを作成
# グラフを一周辿ってノードを並べる
ordered_nodes = list(nx.dfs_preorder_nodes(G, source=start_node))

# 3. 描画
fig, ax = plt.subplots(figsize=(10, 10))

# 修正箇所: nodes= というキーワードを使わず、第1引数に順序付きリストを渡す
pos = nx.circular_layout(ordered_nodes)

nx.draw(G, pos, ax=ax, with_labels=True, node_color='cyan',
        node_size=2500, font_size=10, font_weight='bold',
        width=2, edge_color='black')

# タイトルの設定(padを大きく取って見切れを防止)
ax.set_title("State Space of 2x2 Puzzle ($C_{12}$ Cycle)", fontsize=18, pad=50)

plt.axis('off')
plt.tight_layout(pad=5.0) # 余白を十分に確保
plt.show()
実行結果は以下の通りです。上記リスト10行目で ‘4’ の代わりに ‘_’ を入れた方が分かりやすいかもしれません。結果はC12循環グラフになっています。

“” への1件の返信